Political parties in County Assemblies:
This second part on political parties within county assemblies aims to look at the diversity of parties in each county assembly during each election. As earlier noted, there were were 46, 41, and 48 political parties in 2013, 2017, and 2022 respectively with at least one elected MCA.
Number of parties in each county assembly
During the 2013 election, all the members of county assembly (MCA) elected in Mombasa County were from the Orange Democratic Movement (ODM) whereas Machakos, and Kisii counties had 14 different parties represented in their county assemblies. The graph below shows a summary of the number of counties against the number of political parties in the respective county assemblies for each election. For 2017 and 2022 elections, the number of political parties ranged between 2 and 12 in all the county assemblies. In 2017, Bungoma, Wajir, Nyamira, Machakos, and Kisii had 10 or more political parties in their county assemblies while the least number (2) was present in Nyandarua, Kirinyaga, Elgeyo-Markwet, Laikipia, Kericho, Bomet, and Siaya counties.
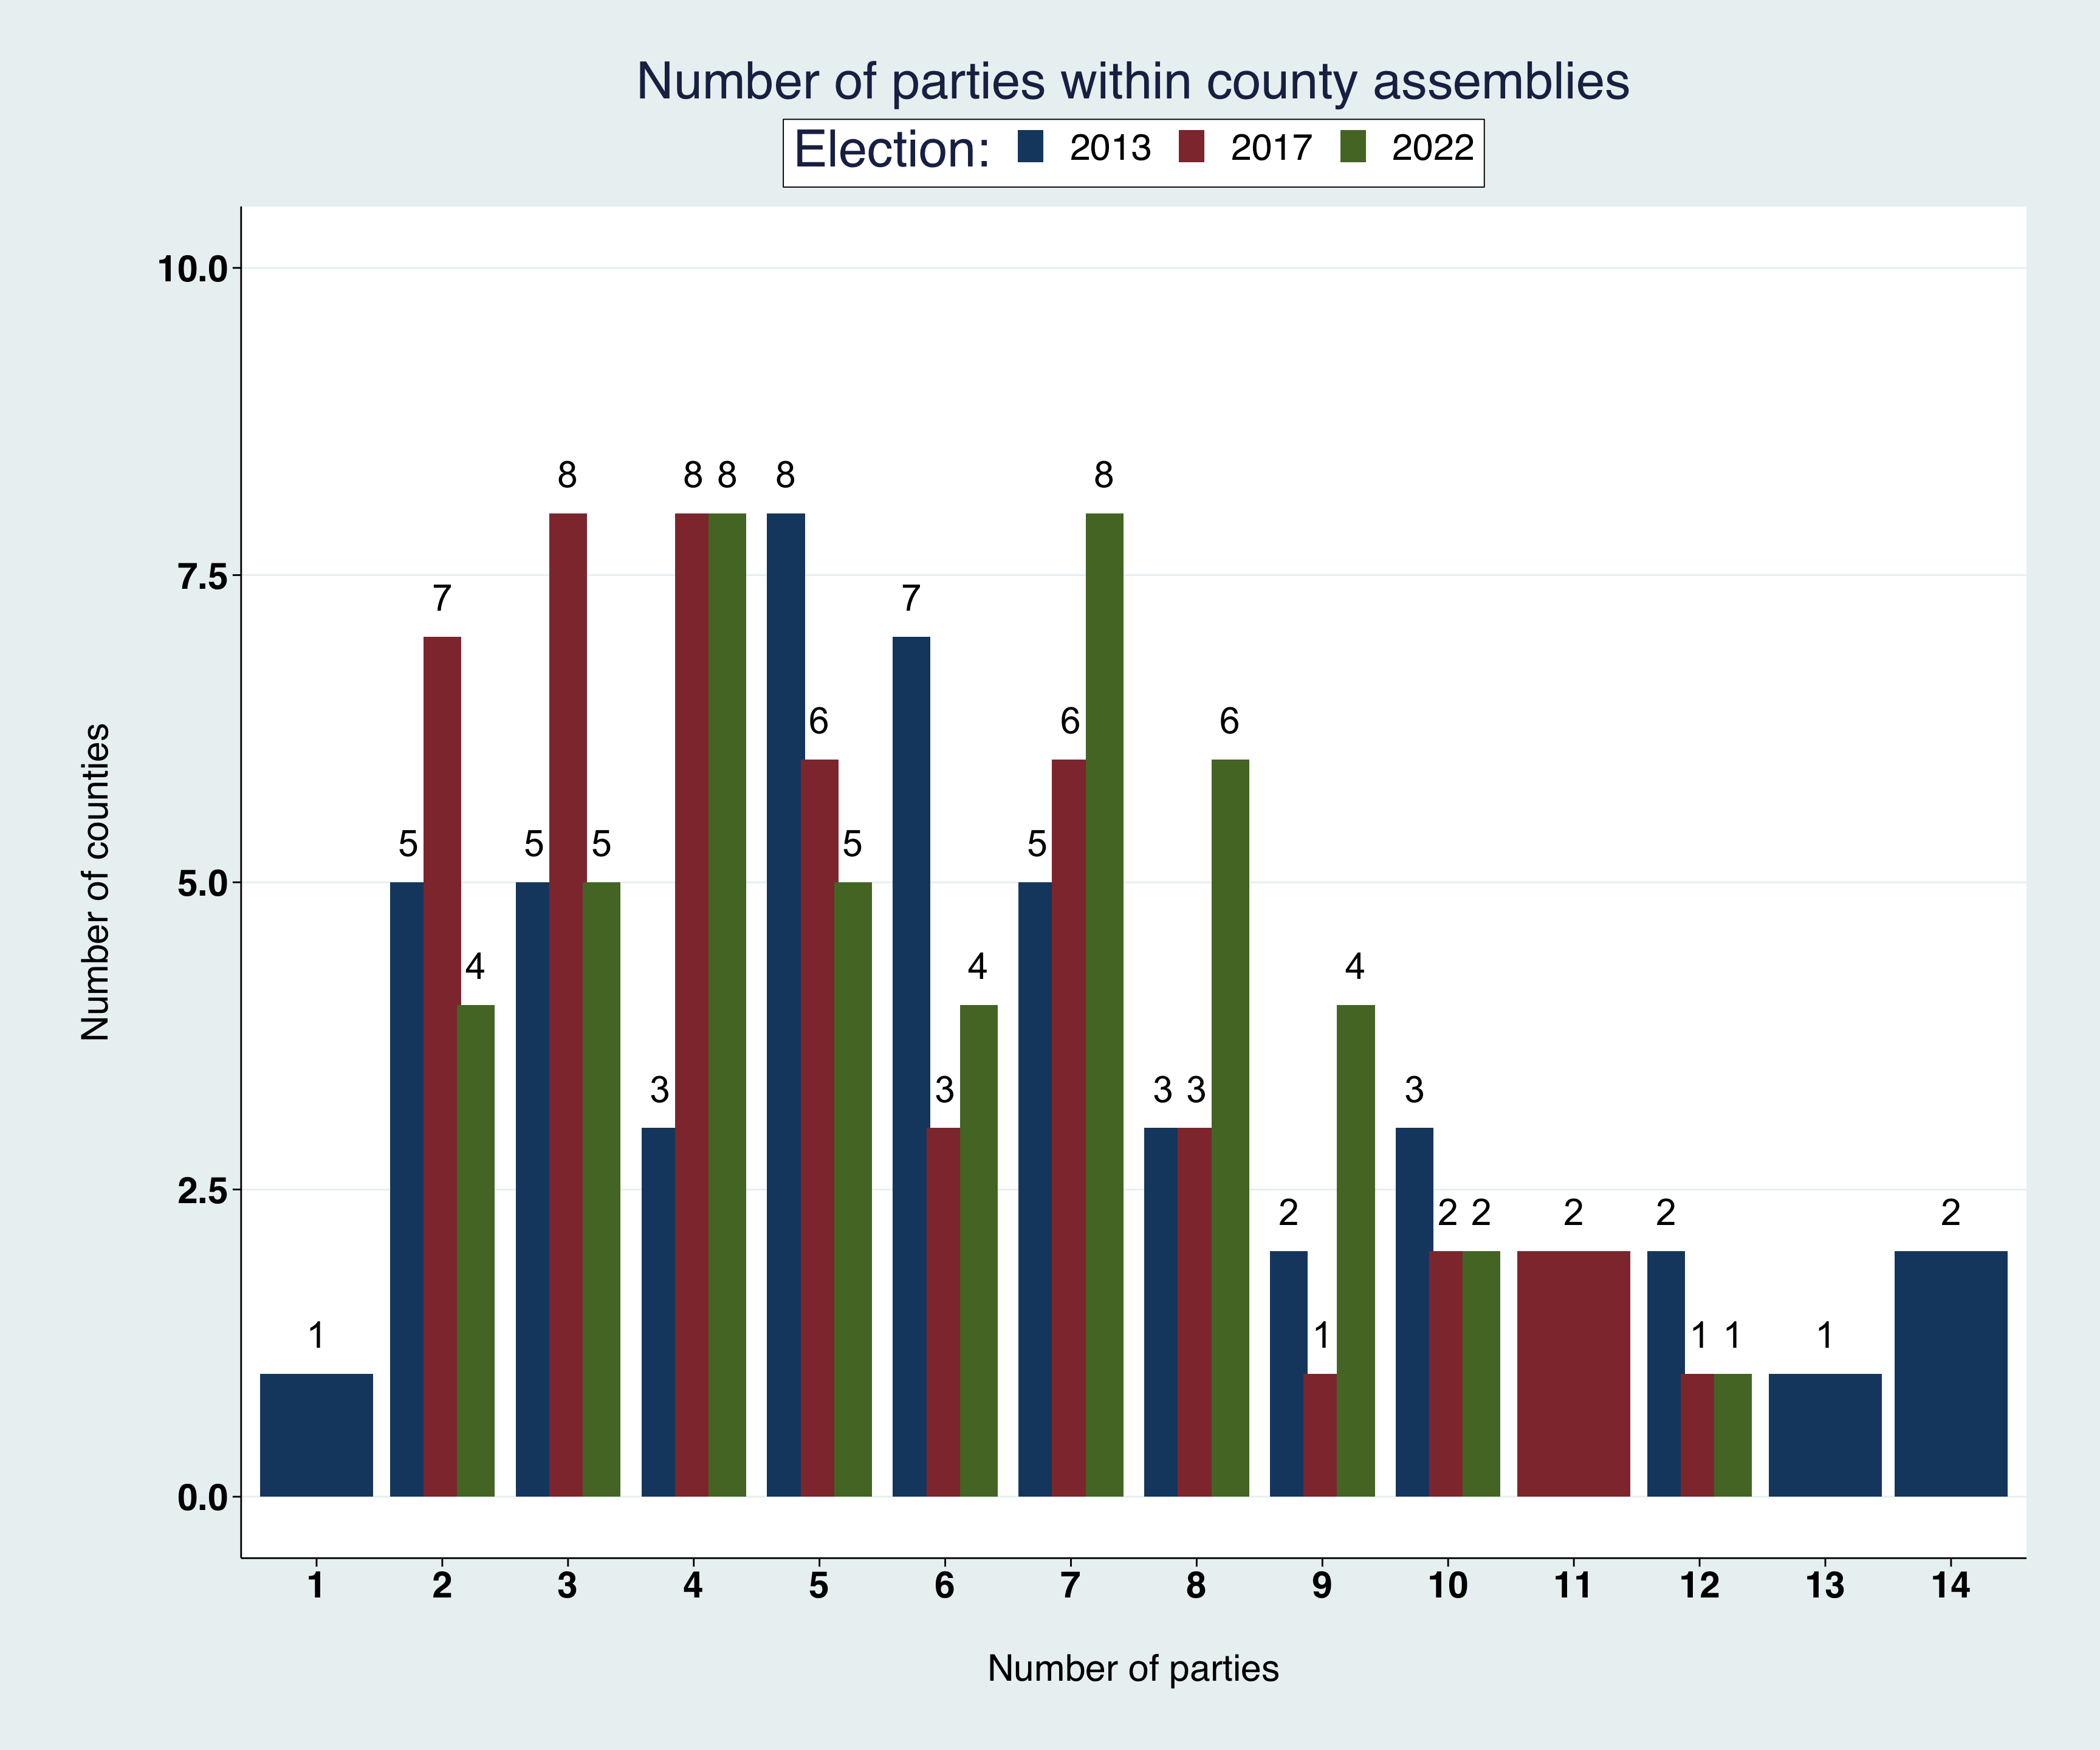
After the 2022 election, all the elected MCAs in Elgeyo-Marakwet, Kericho, Kisumu, and Homa Bay county assemblies were from 2 political parties while Kisii (12), Wajir (10), and Nyamira (10) counties elected MCAs were from 10 or more political parties.
Number of counties the popular parties are represented in
From the 46 parties with at least one elected MCA after the 2013 election, Orange Democratic Movement (ODM), The National Alliance (TNA), and United Republican Party (URP) were the most broadly represented with at least one elected MCA in 33, 32, and 29 counties respectively. Jubilee Party (JP) had at least one MCA in over 85% (40) of counties compared to ODM (57%) with independent candidates being elected in 35 counties during the 2017 election.
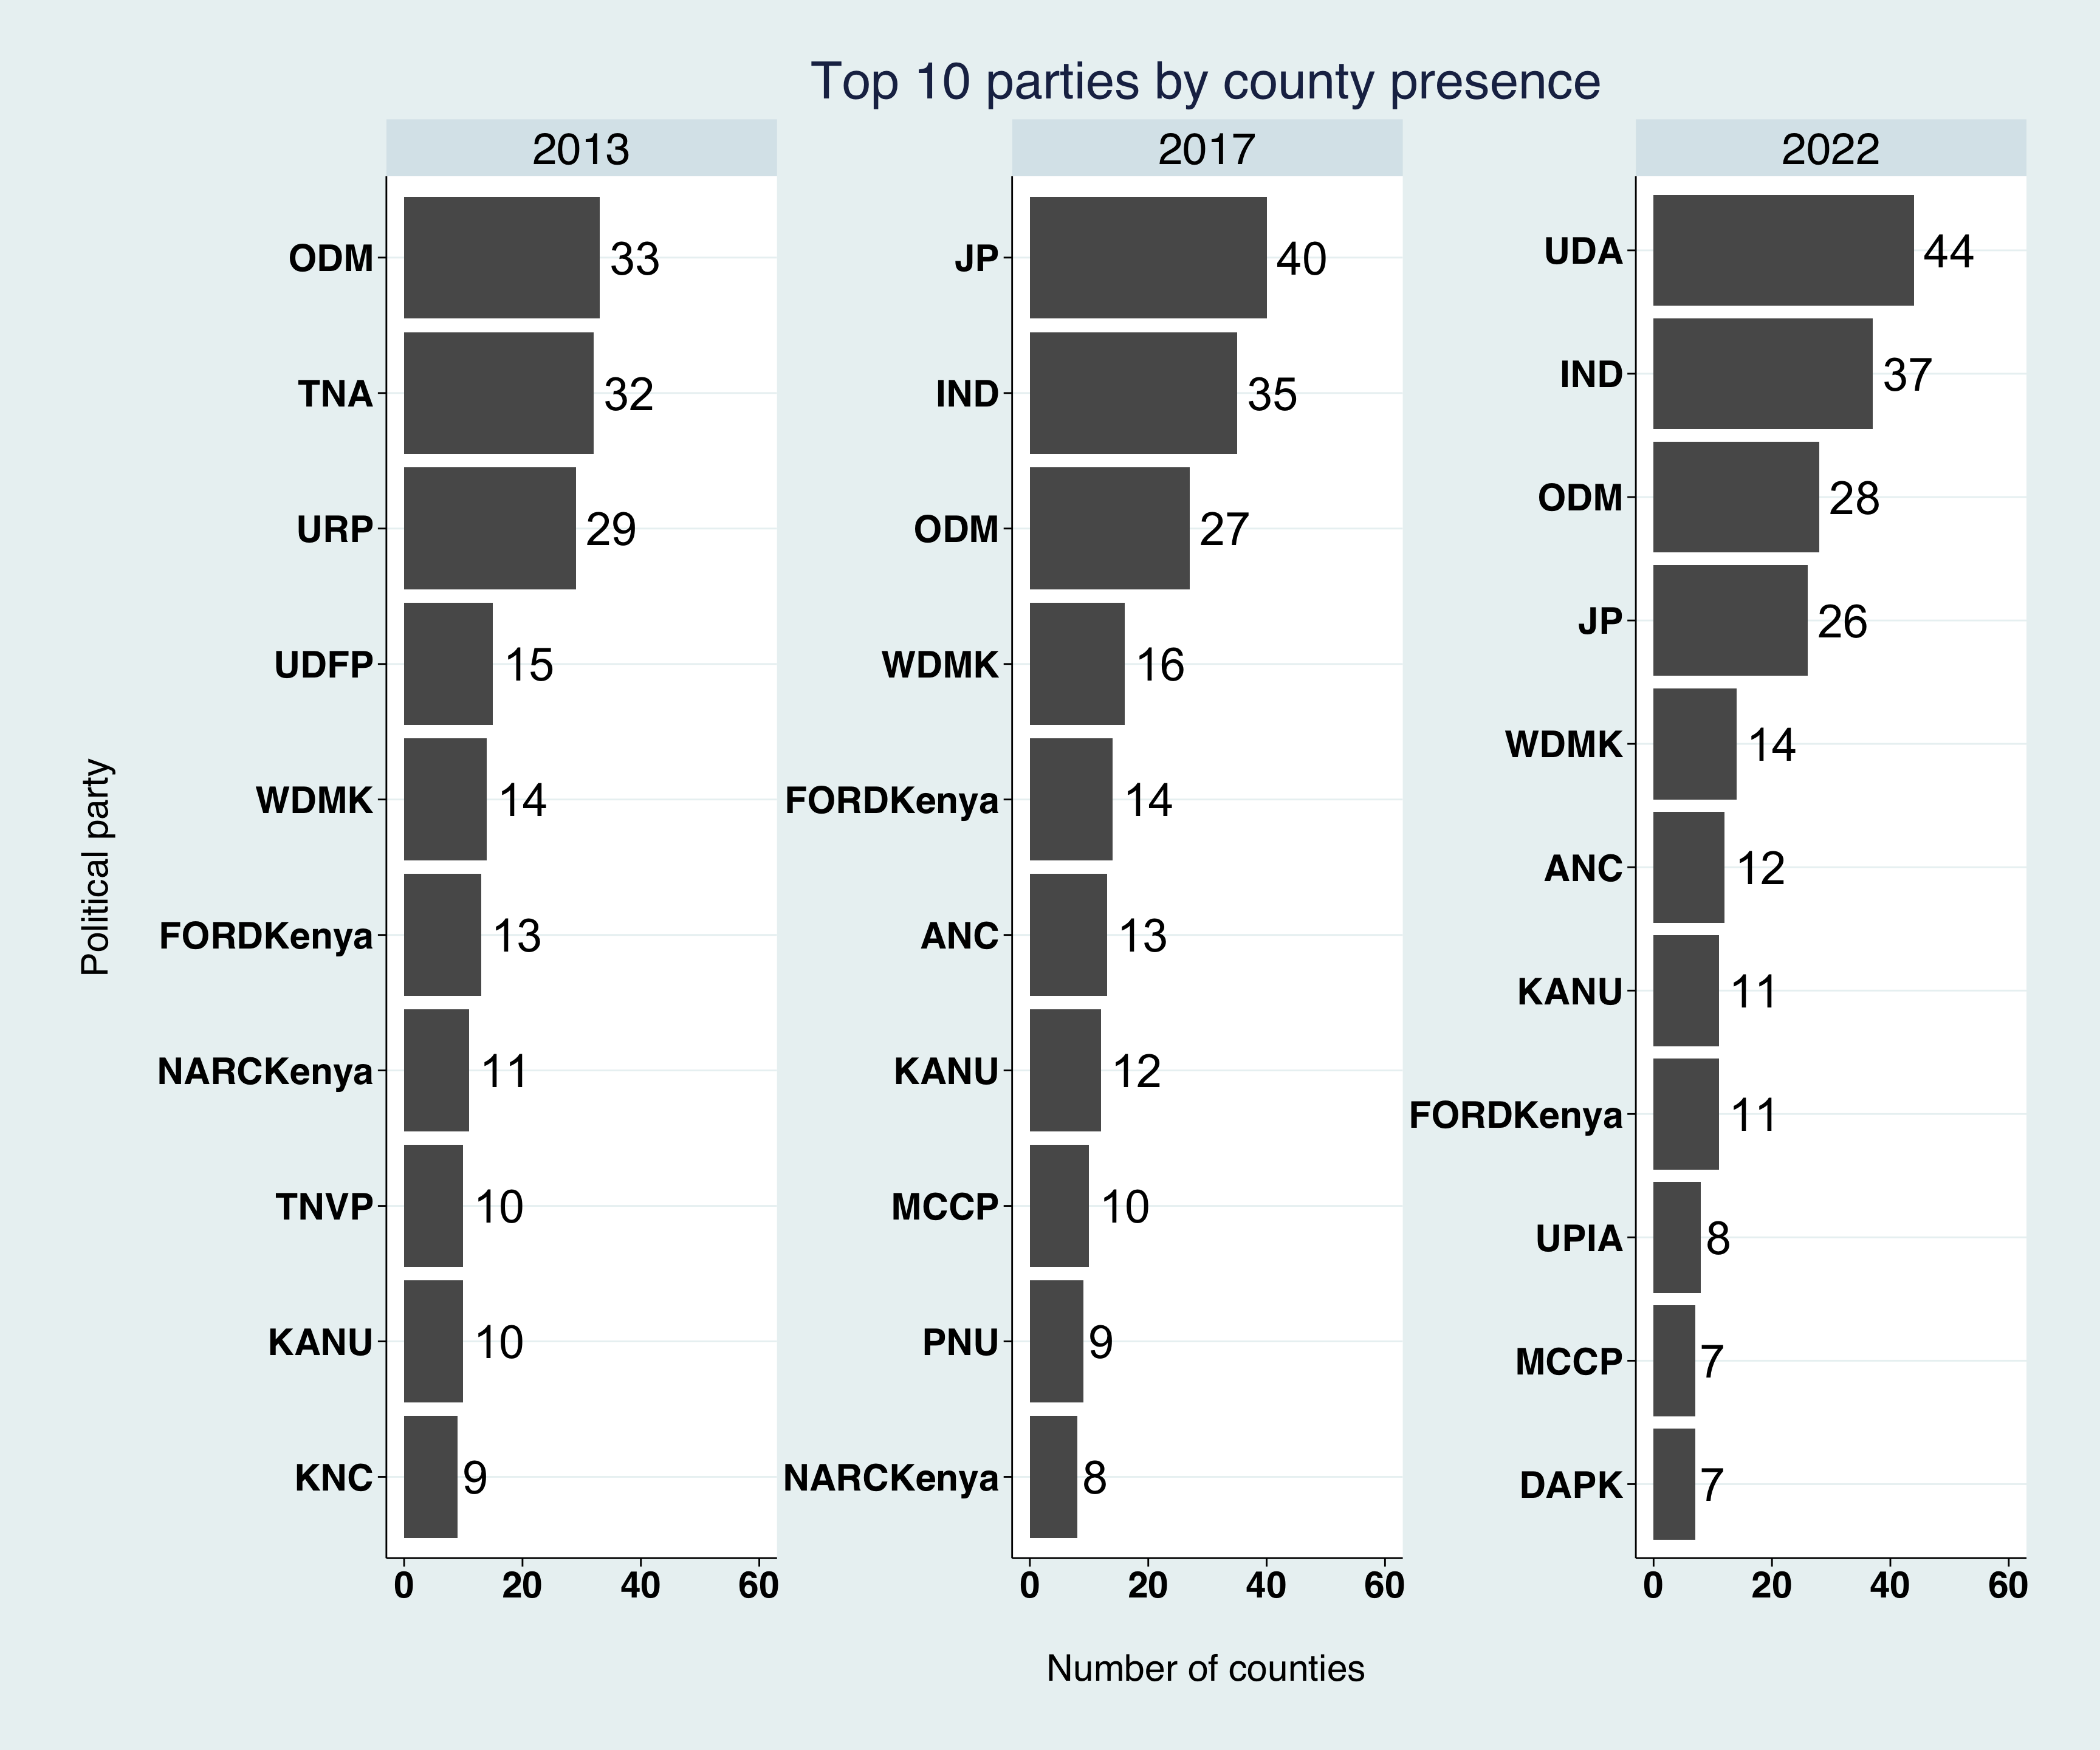
United Democratic Alliance (UDA) was the dominant party during the 2022 elections, and this is visible in it’s presence of elected MCAs in 44 of the 47 counties with only missing an MCA in Lamu, Kisumu, and Homa Bay counties. ODM and Jubilee parties were elected in 28 and 26 counties respectively while independent candidates were elected in 37 counties.
Who controls each county assembly?
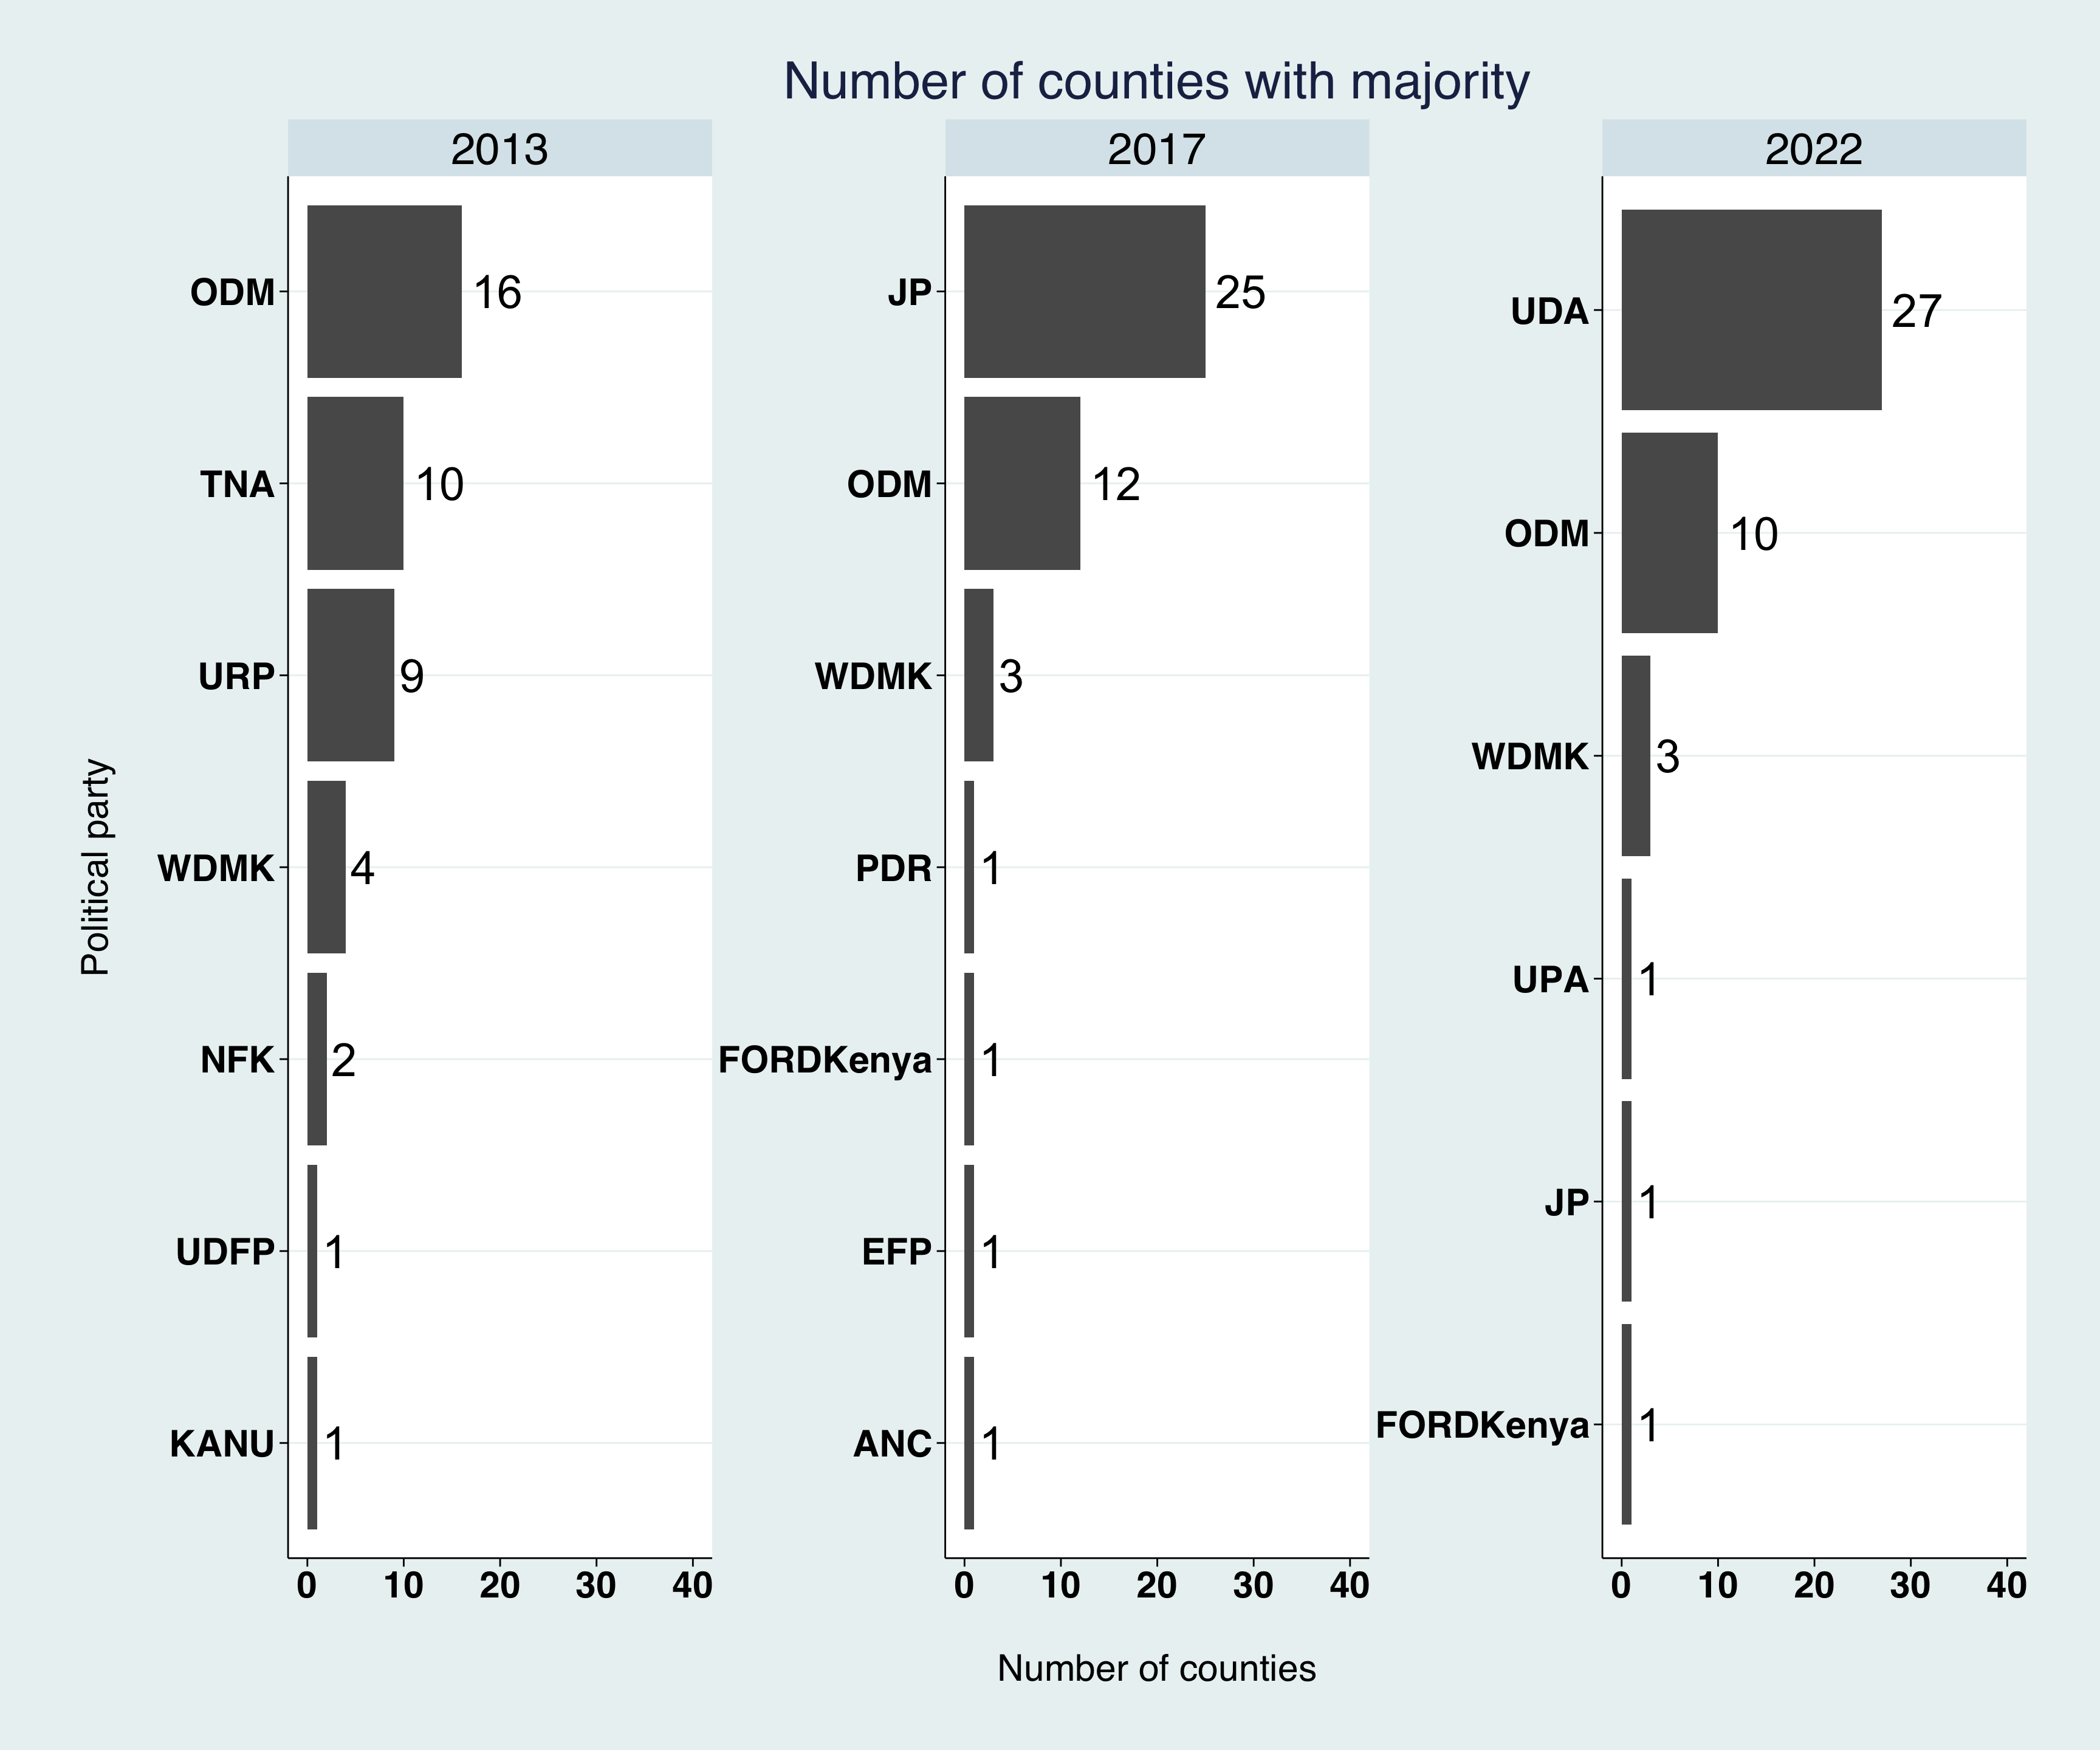
Below is the summary of parties with majority number of elected MCAs in by county for each election. During 2013, ODM had the majority in 16 counties compared to 10 and 9 for TNA and URP respectively while in 2017, Jubilee lead with a majority in 25 counties compared to 12 for ODM. For 2022 election, UDA controls 27 counties compared to 10 for ODM and 3 for Wiper Democratic Movement (WDM). These numbers are exclusive of the counties where two or more parties split the majority for example in the case of Nairobi County during 2022 where both UDA and ODM have 35 elected MCAs.
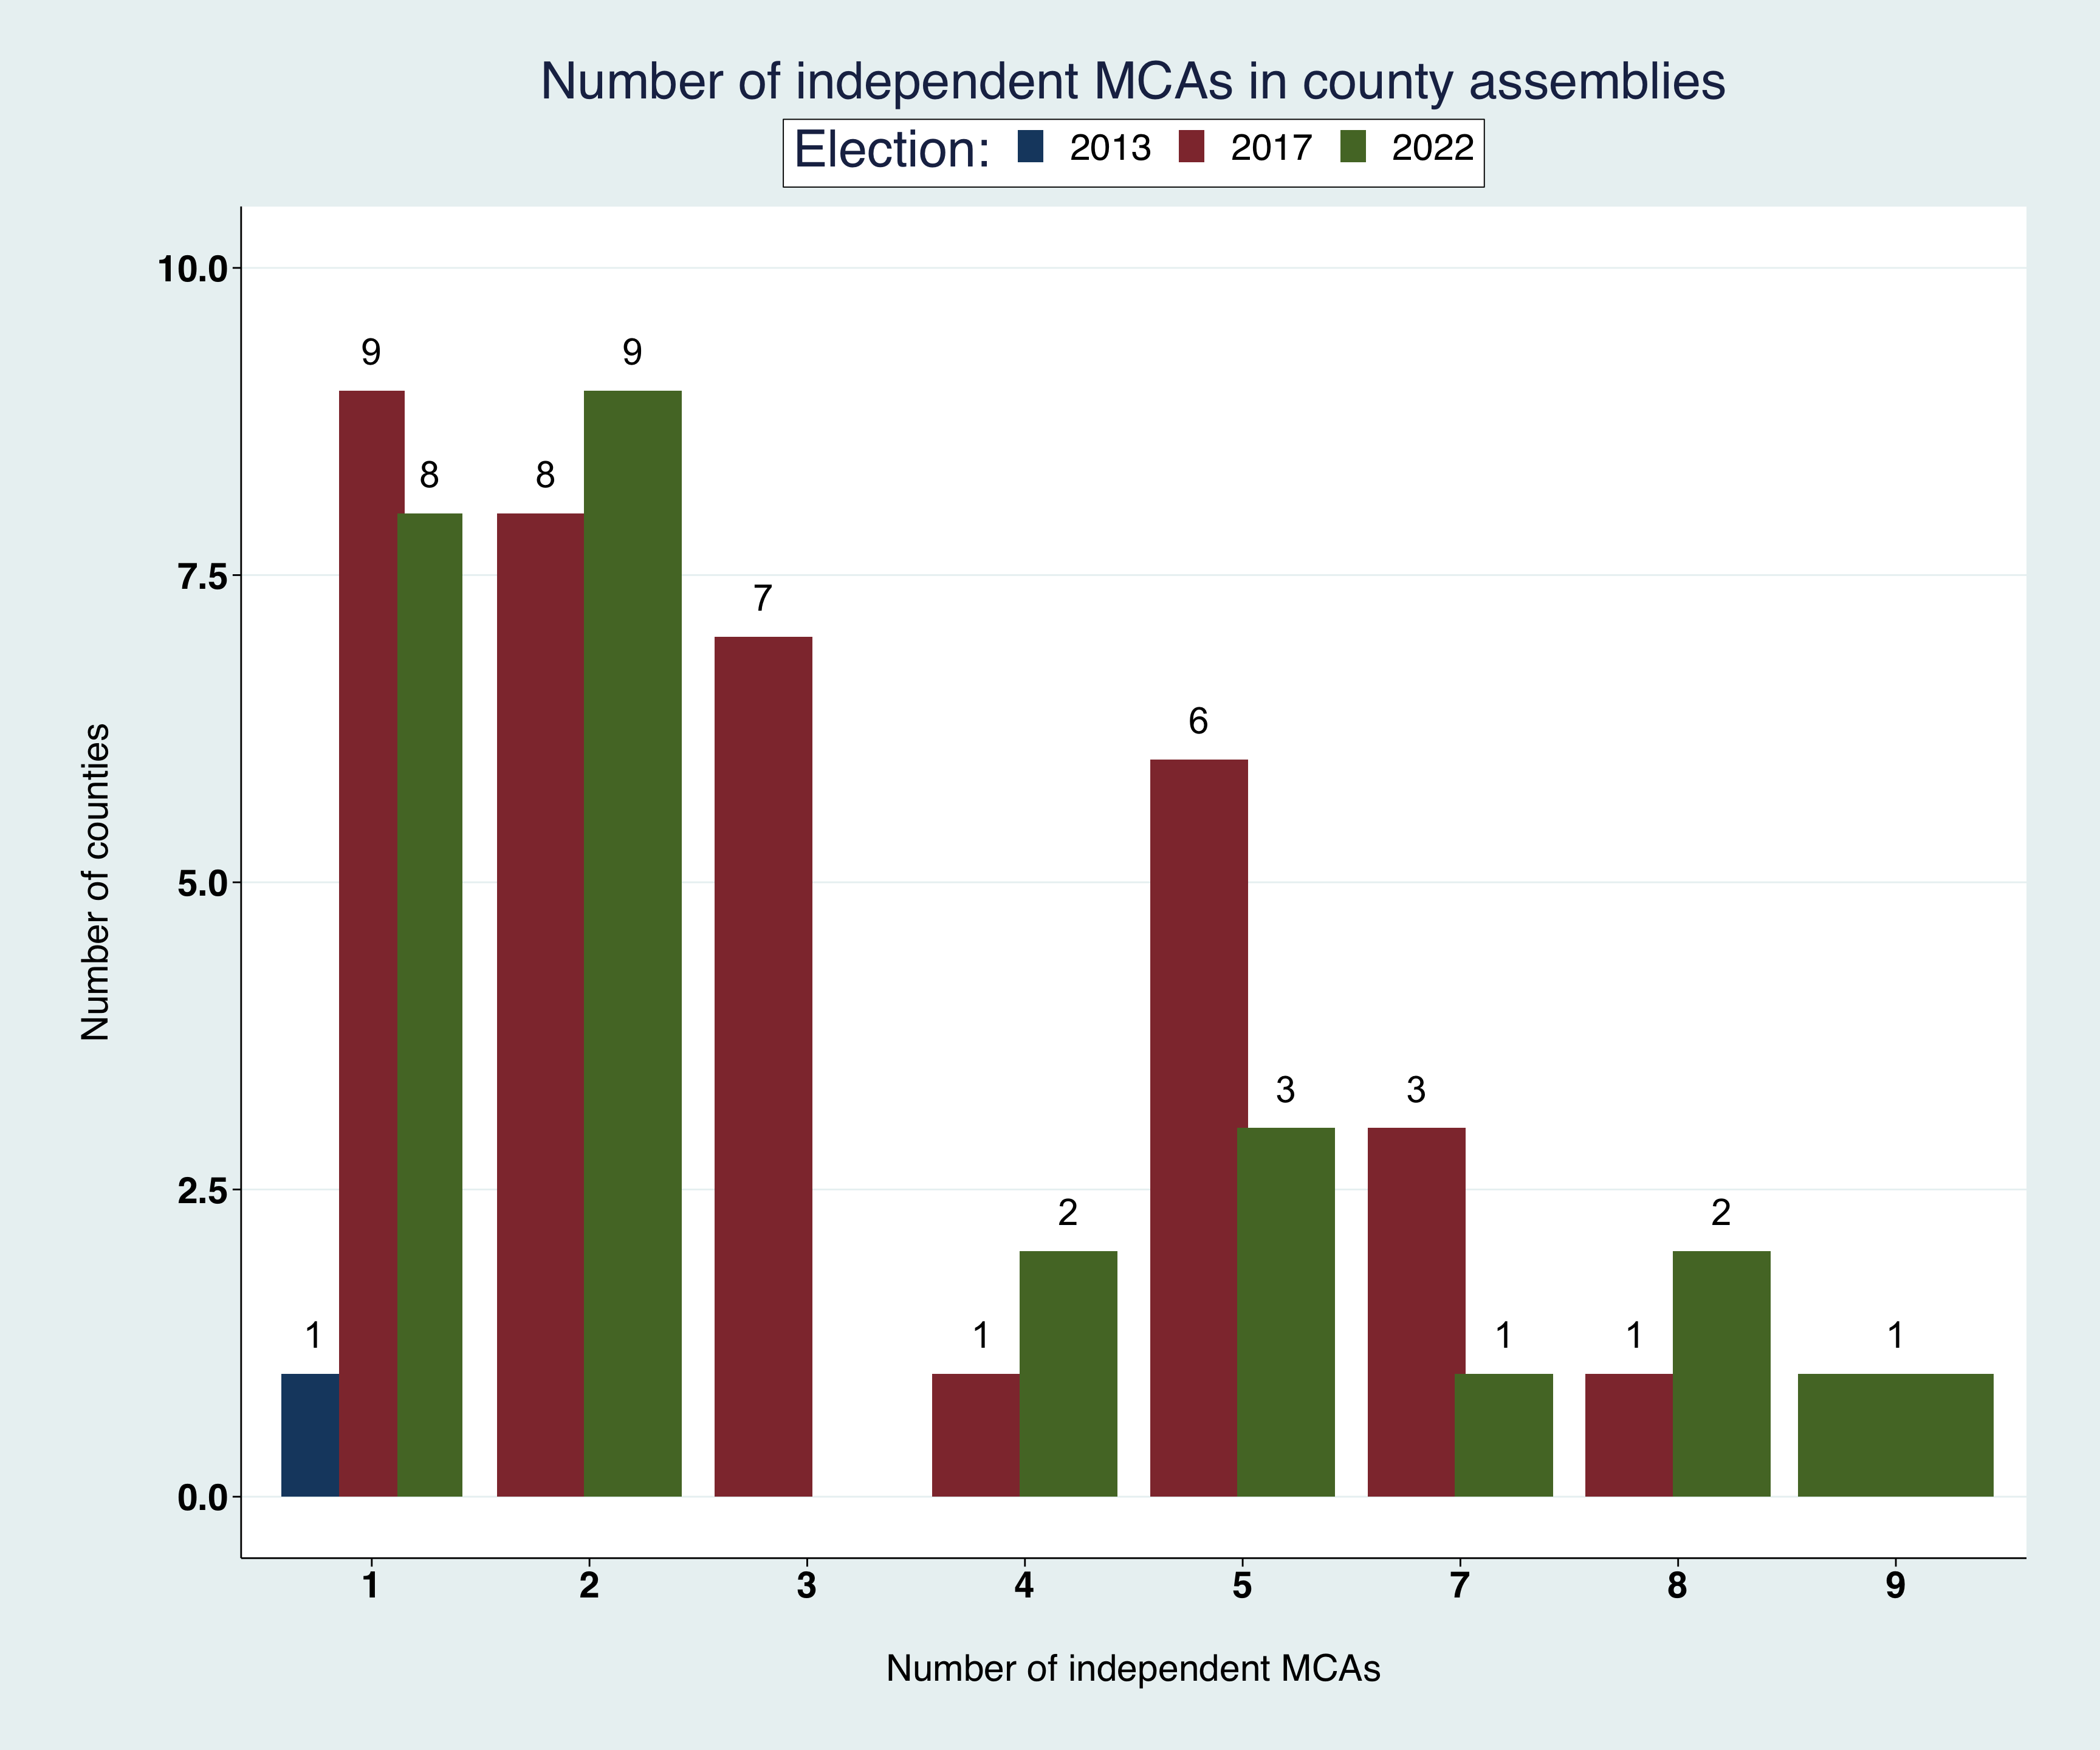
Where are independent candidates elected?
The number of elected independent MCAs is notable especially during the 2017 and 2022 elections with an independent MCAs elected in 35, and 37 counties respectively compared to only one county (Bungoma) in 2013 elections. Below I look at counties where these candidates are elected. The higest number of independent MCAs is in Kitui County in 2022 with 9 members while in 2017, eight independent MCAs were in Meru County.