MPESA Costs: Exploratory analysis
In this blog post I’m going to show how I processed data from my M-Pesa monthly statements from January 2016 to December 2019. M-Pesa is a mobile phone-based money transfer, financing and microfinancing service, launched in 2007 by Safaricom Limited. A user of the service is notified of transfer or receipt of money via text messages.
A users monthly transaction history using the platform can be shared upon subscription to receipt of monthly statements which follow a particular format and send to the user’s email. The statement has a summary statement of the total amount of money transfered, received, payment for services etc besides a detailed statement of each transaction within the calender month.
The statement are shared in encrypted PDF documents where the user has to use his/her ID to access. In order to create Excel sheets from the tabular summaries within the PDF documents, I saved each of the statements as a new PDF document without the encryption. I then used Tabular to extract each of the two summary statements to Excel (xlsx) workbooks for each month which are further processed as shown in the code sections below.
Load libraries
Below I import the required packages that enable data processing and visualization.
Load data
All the extracted Excel files are all stored in the same folder whose path is indicated below. In order to import all the files for each month, I use two list objects;
- statement_summary: will be a list of summary statements
- statement_detailed: will be a list of detailed statements
Each of the holds the specific monthly statement for each month. While importing the data files for the detailed statements I specify the column types for the 7 columns within each of the statements.
Data processing
In the section below I combine all the monthly statements to individual files. I use ldply function from the plyr package which takes in a list(s) and returns a dataframe in this case. Next I work on the column names to harmonize them for ease of use/reference. I like column/variable names within my datasets in lower case and use of underscores (_) rather than a fullstop(.) between variable names that have more than one word.
Next, within the detailed statements data, I compute the columns below using the mutate function of the dplyr package:
- Transaction completion date and time (completion_time): - converted in a proper date element with year, month, date, hours, minutes and seconds using the ymd_hms function from the lubridate package.
- Transaction year (tran_year): - This is extracted from the formated transaction date-time column.
- Transaction month (tran_month):- This is also extracted from the formated transaction date-time column. This is then converted to a factor with the names of calender months.
In the final part of this code section, I create a character vector (charges) with the names of the transaction categories which I’m interested in. The three categories represent the different types of transaction charges depending on the type of transaction:
- Withdrawal Charge: Cost incured when withdrawing money from the various options where a user can withdraw funds from their M-Pesa account.
- Pay Bill Charge: Cost incured when making merchant payments or transfer or receipt of funds to/from entities such as banks.
- Customer Transfer of Funds Charge: Cost incured when sending funds to other M-Pesa users or non-users.
Exploratory data analysis
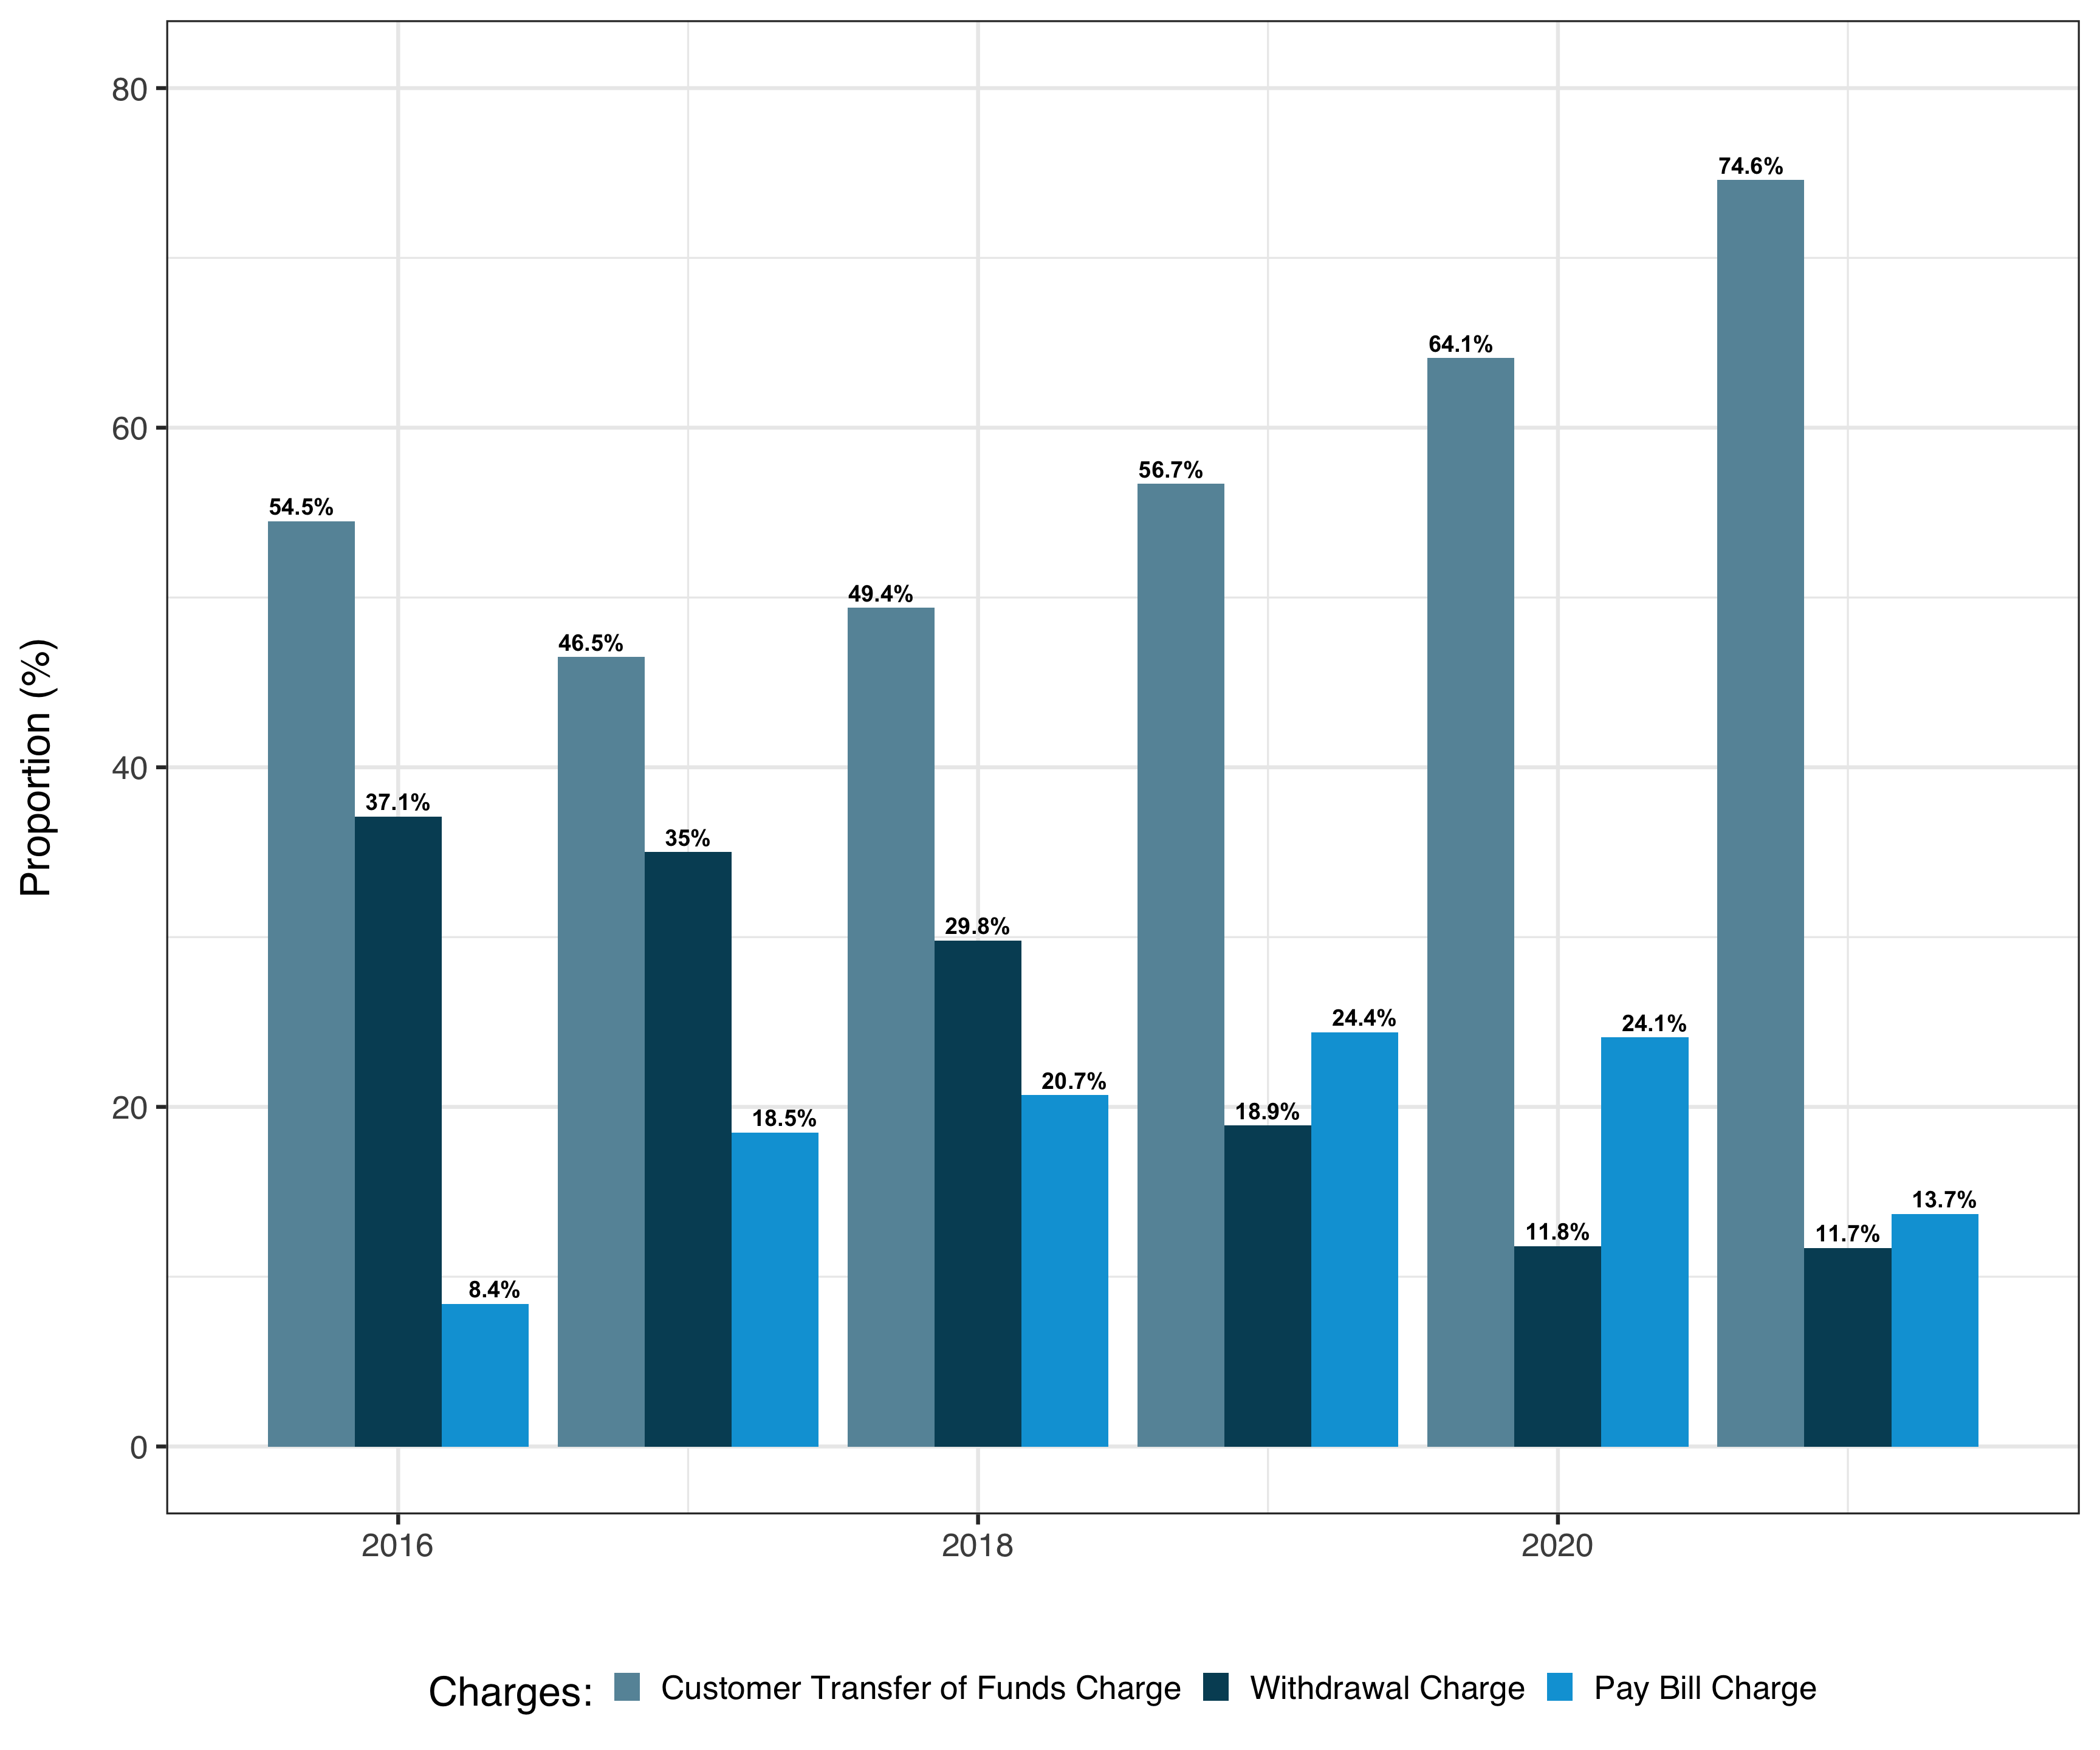
Proportion of charges by year
The graph below shows the proportion of charges for each category to the total charges for each year. Its notable that withdrawal charges have been decreasing over time. Withdrawal charges started off at 37% in 2016 compared to 29.8% in 2018 and accounting for 20.9% of the total charges within 2019. This is mostly due to most entities adopting mobile payments options.
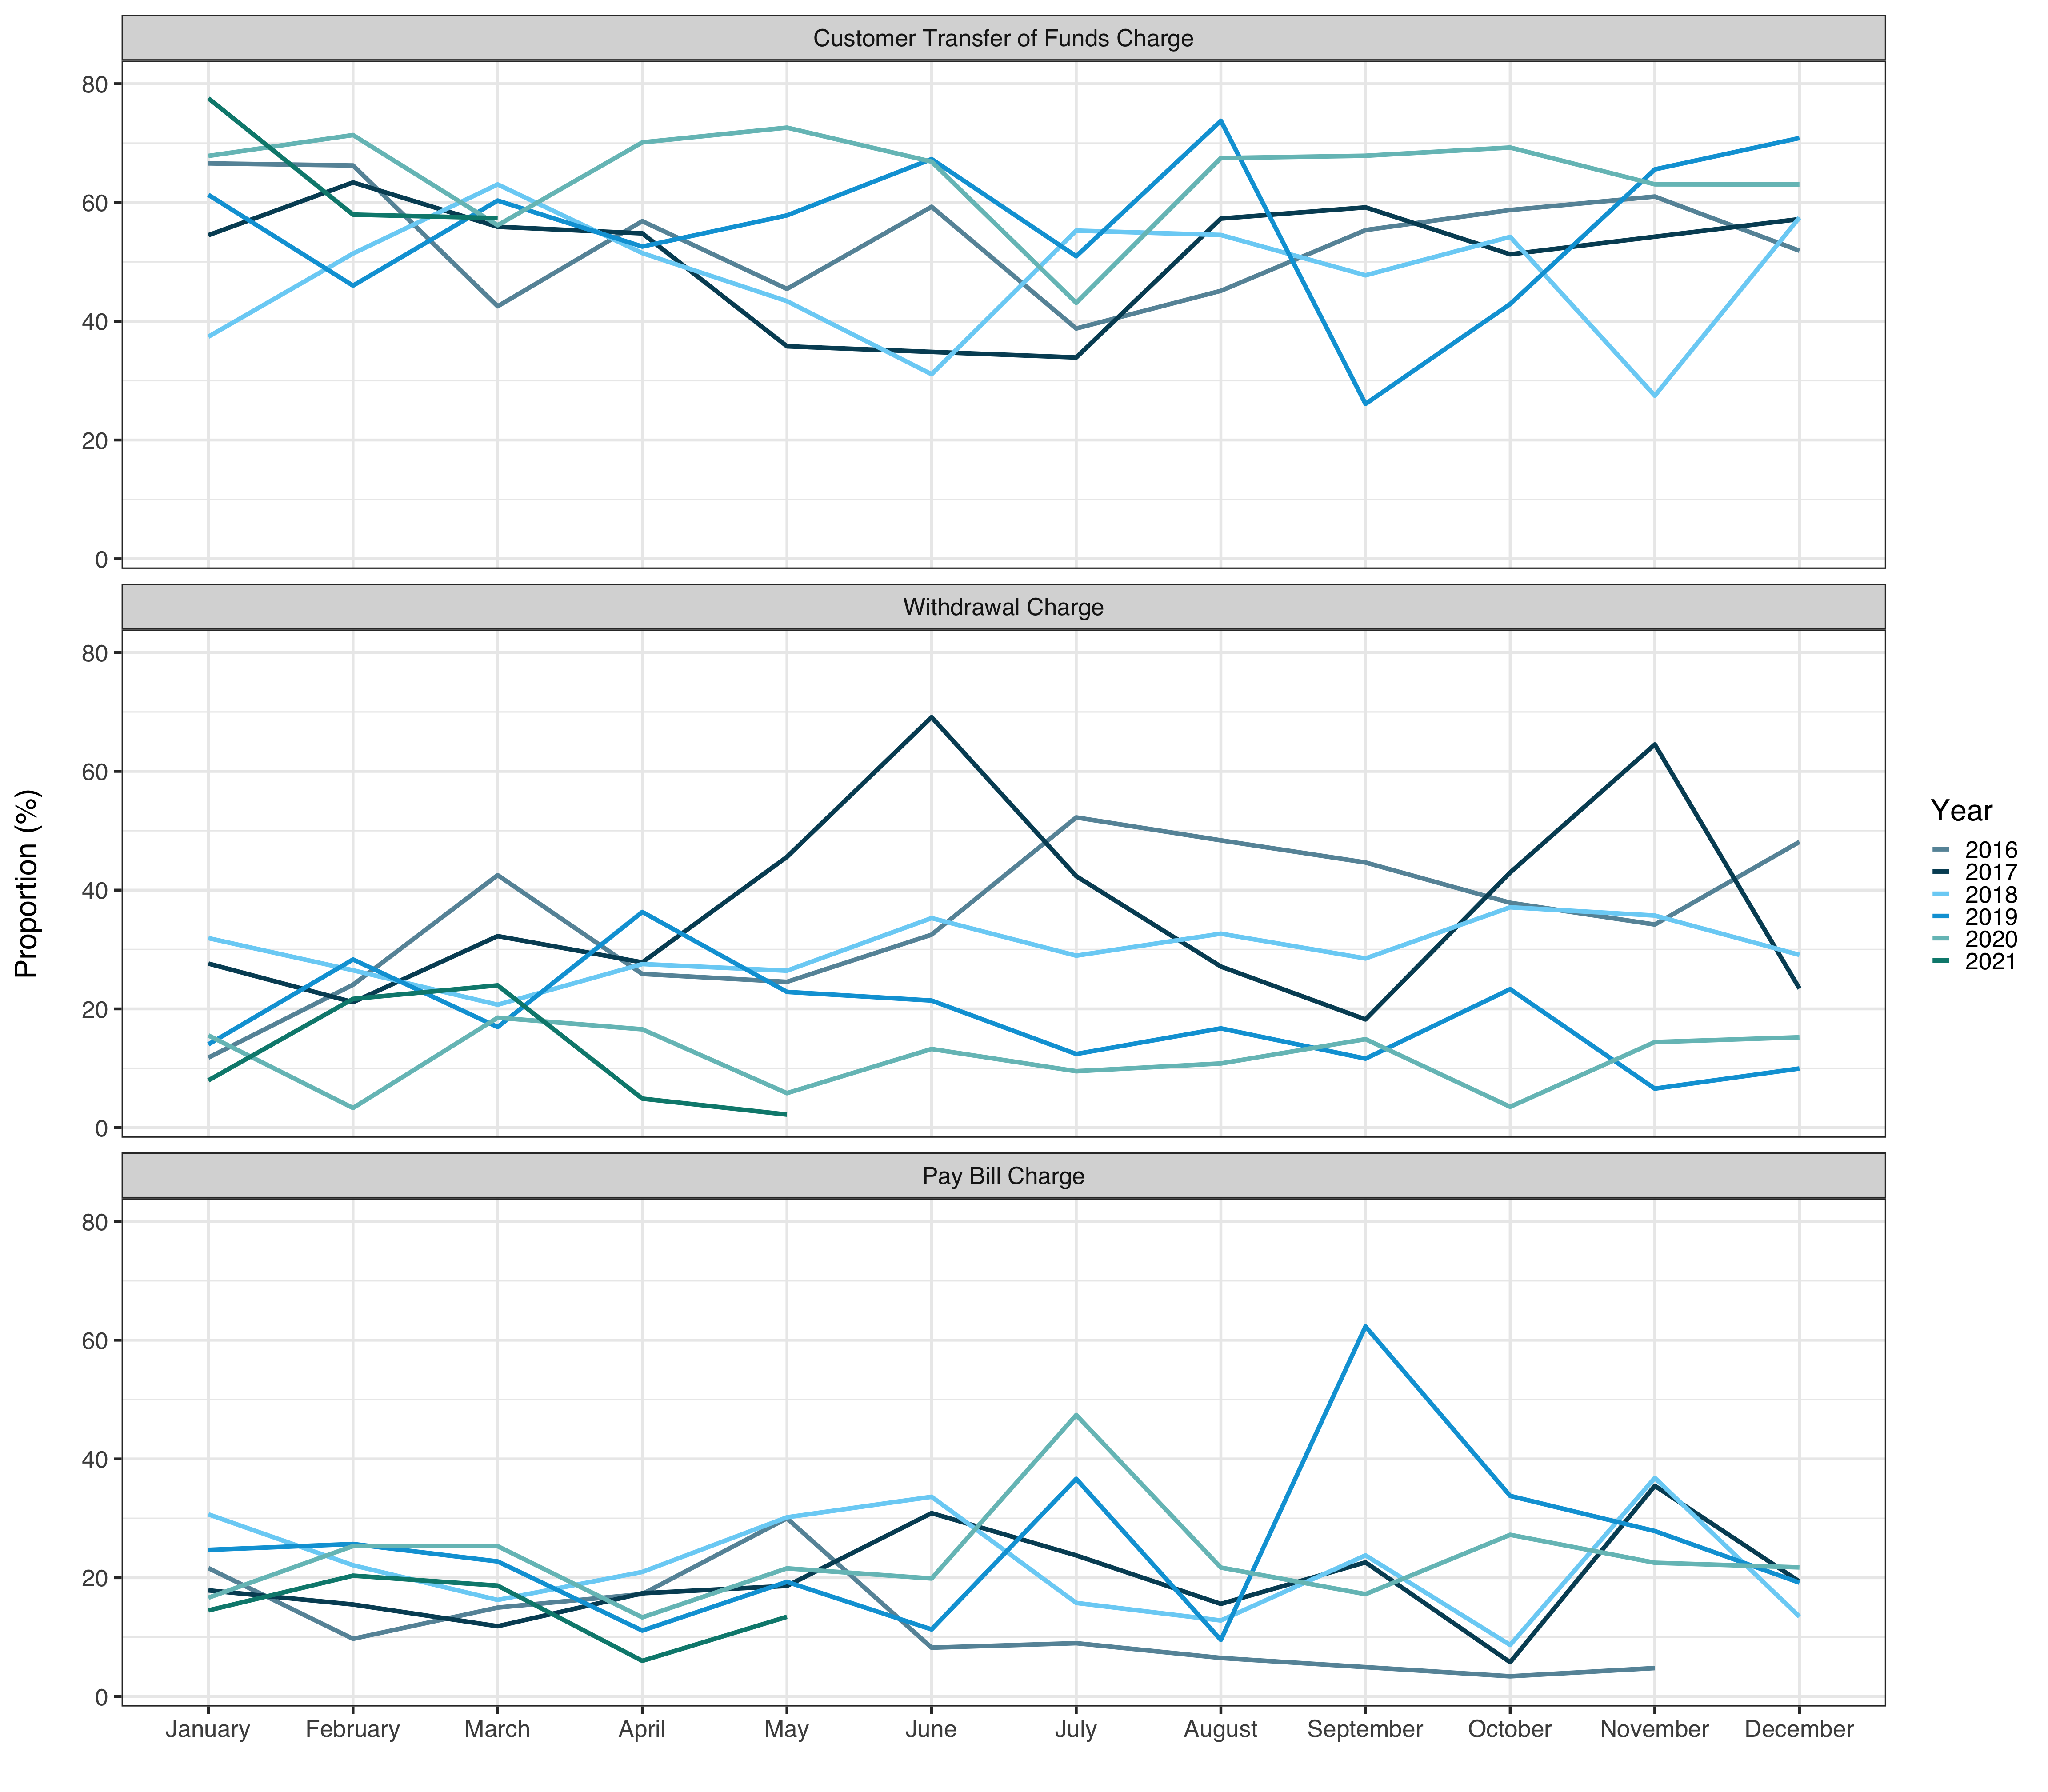
Trend of charges by month
The trend of the proportion of charges within each year is presented below. Across the four years, transfer of funds charges account for most of the charges within each year.
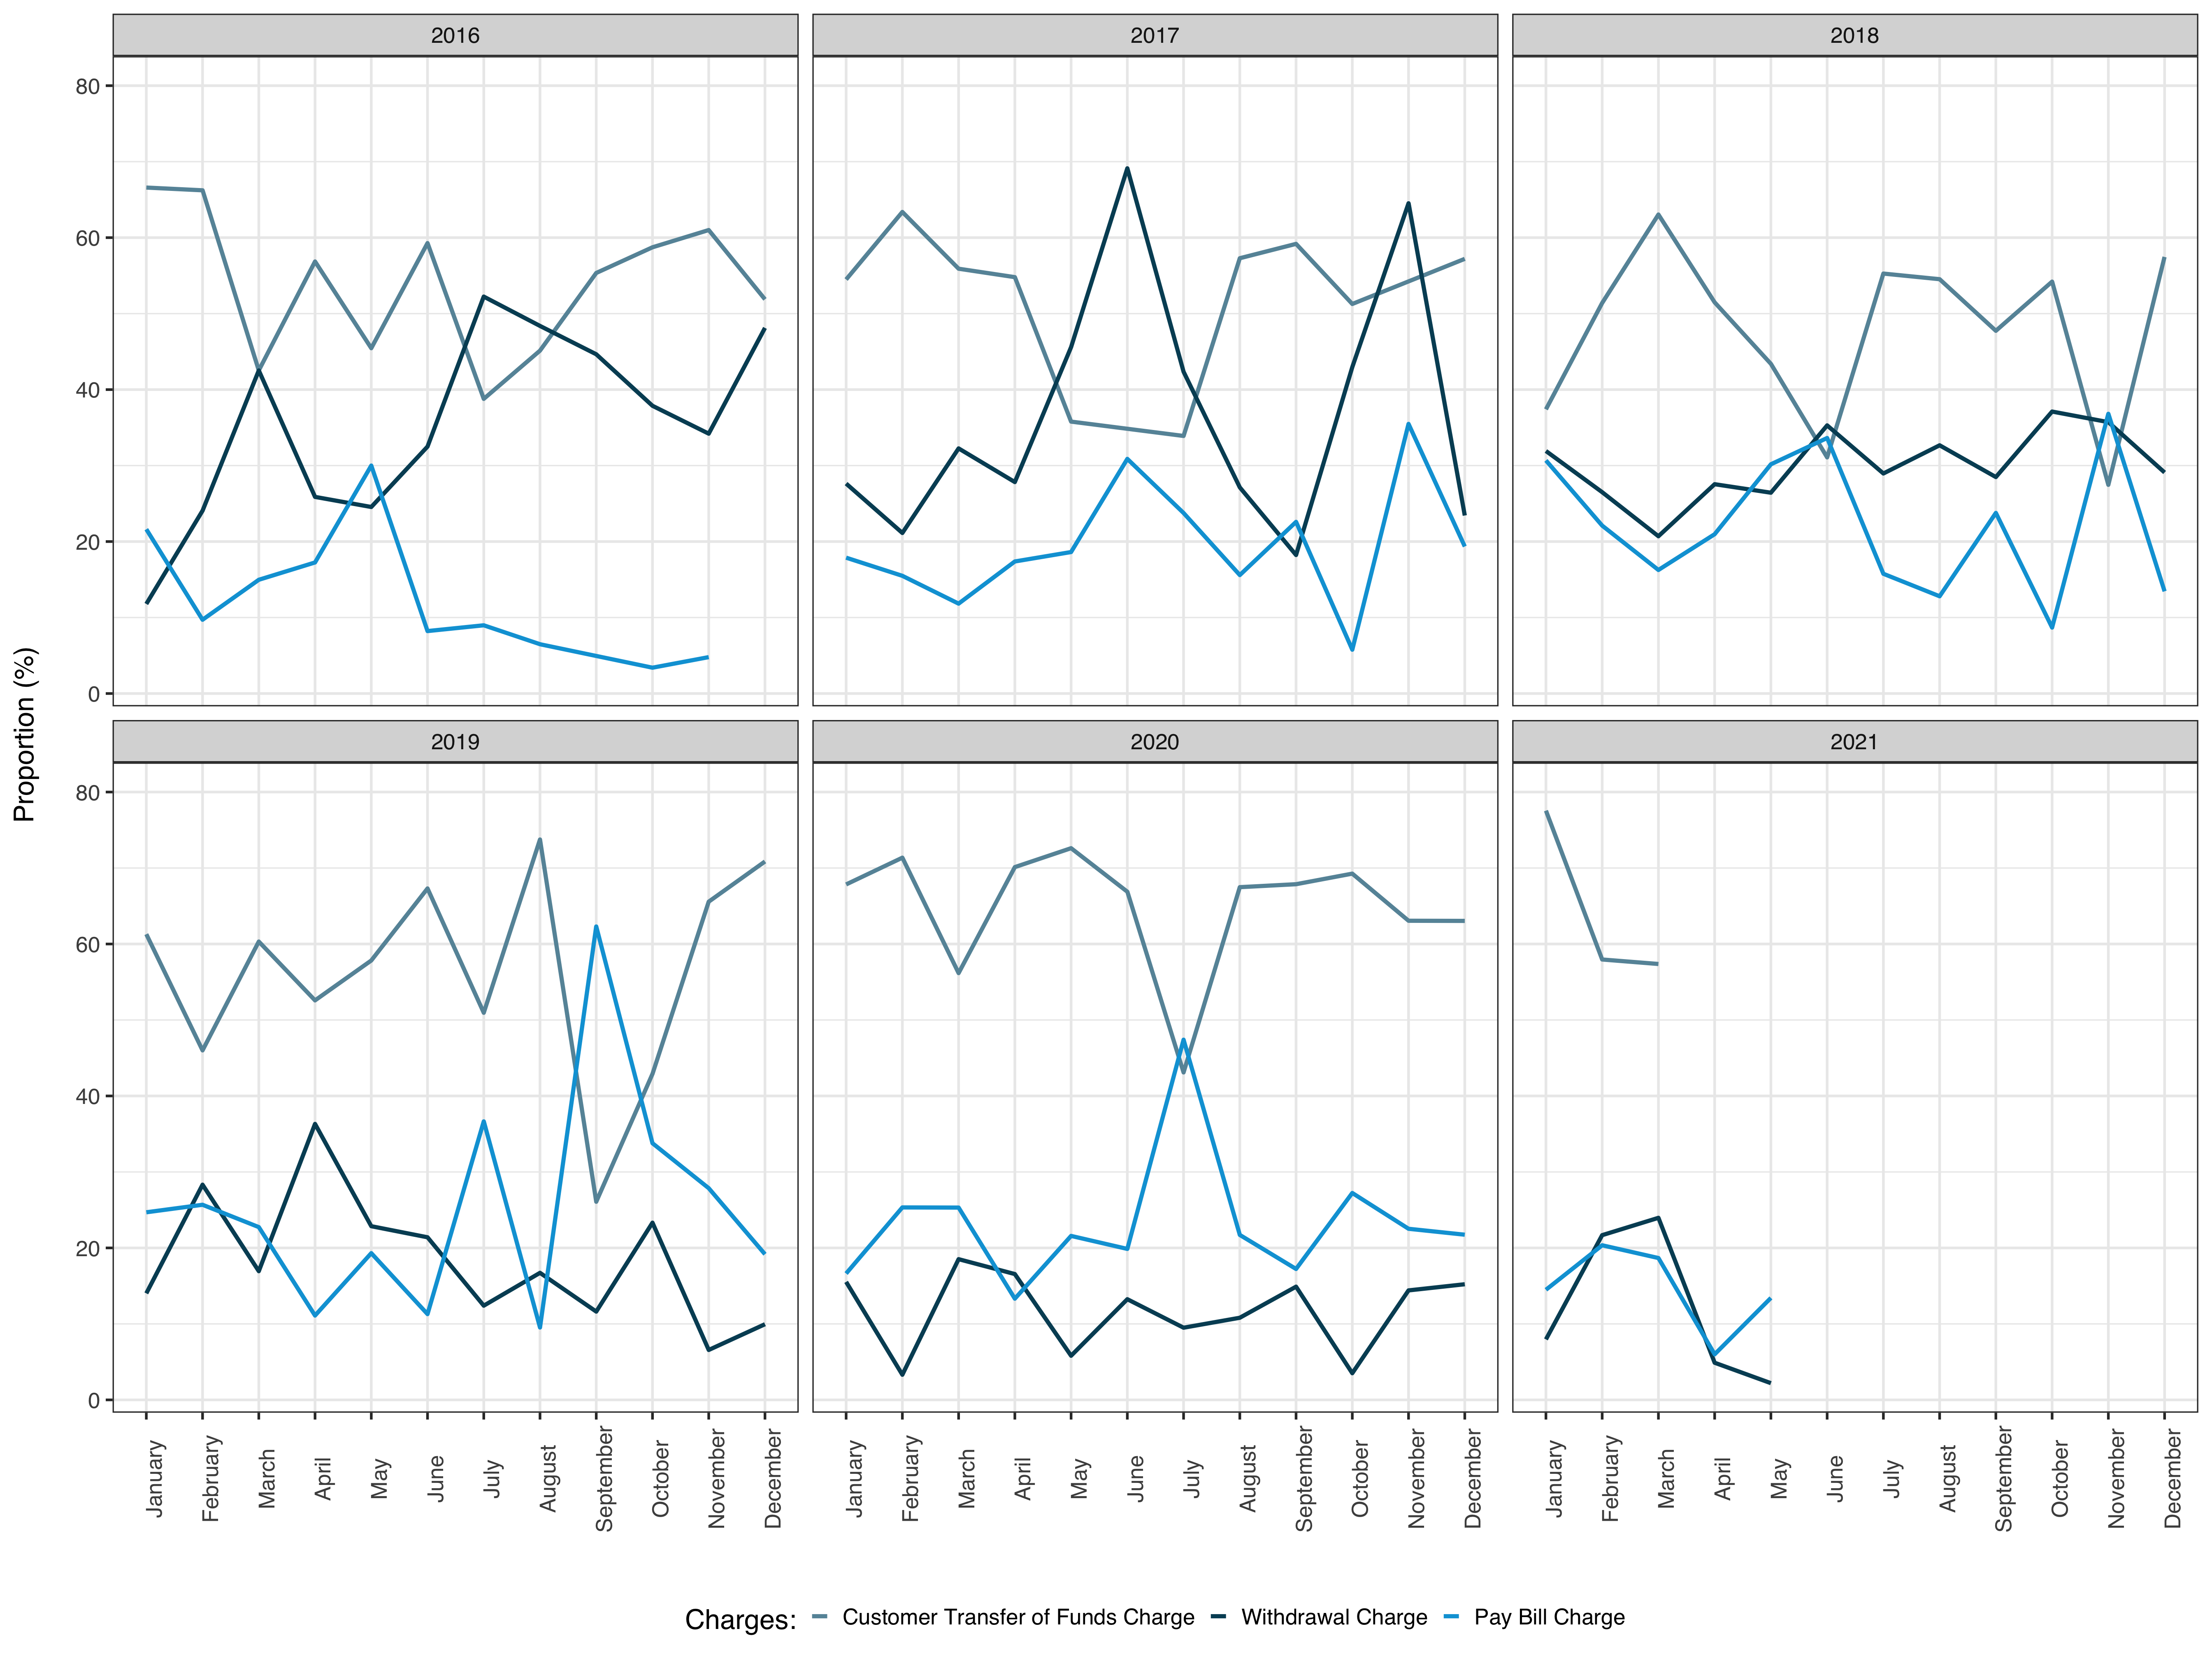
The graph below offers a different perspective of viewing the same data presented above. The trend of each charge category is compared across each year.